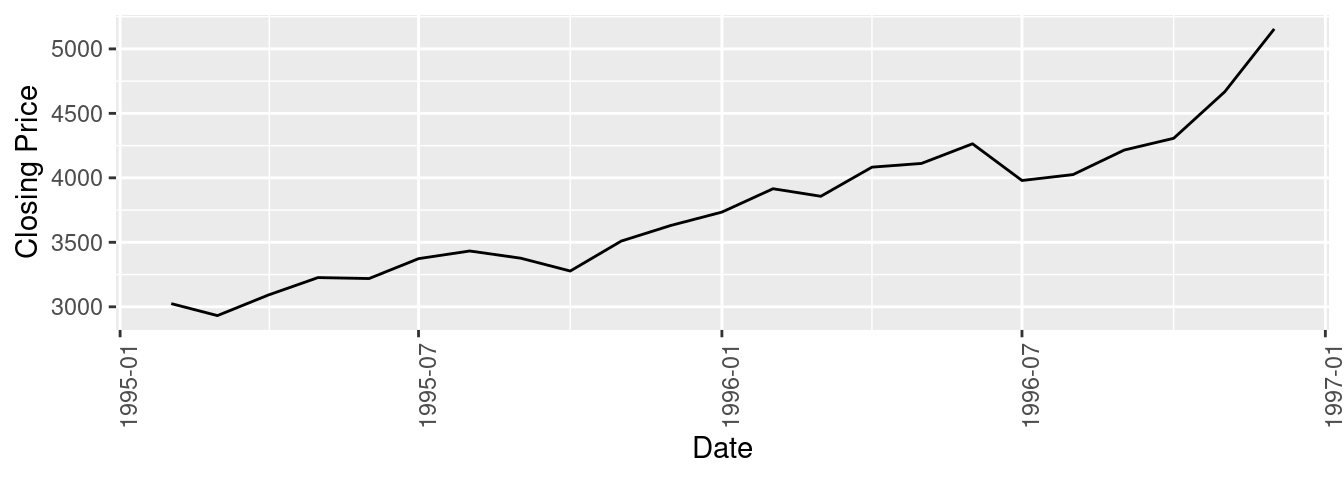
Own elaboration: By using RStudio with the IBEX historical database, obtained from https://finance.yahoo.com/, in the period between 01-1995 to 01-1997.
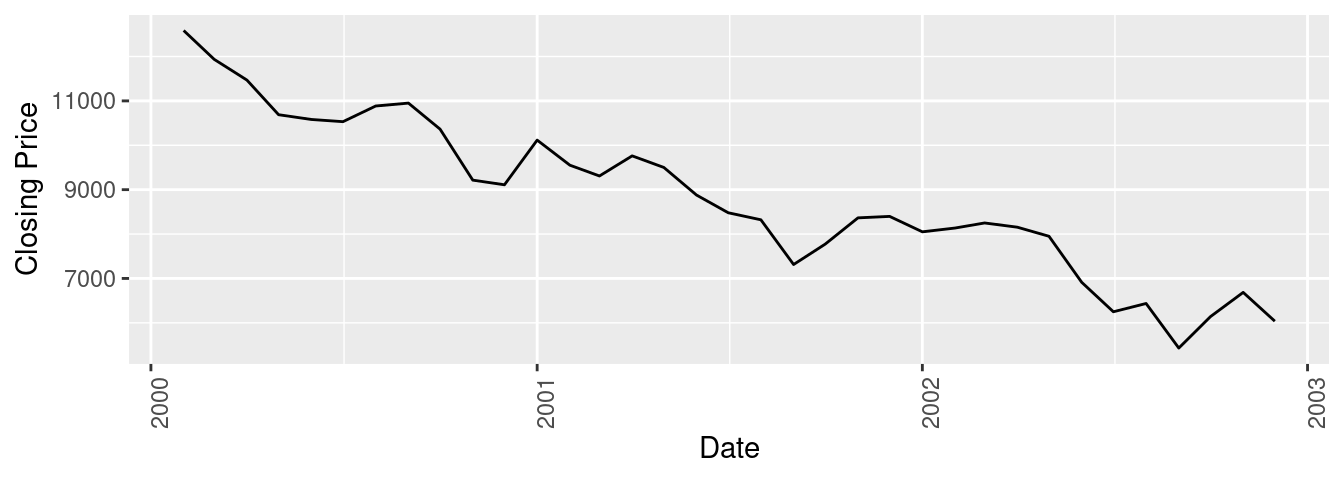
Own elaboration: Through the use of RStudio with the IBEX historical database, obtained from https://finance.yahoo.com/, in the period between 01-2000 to 01-2003.
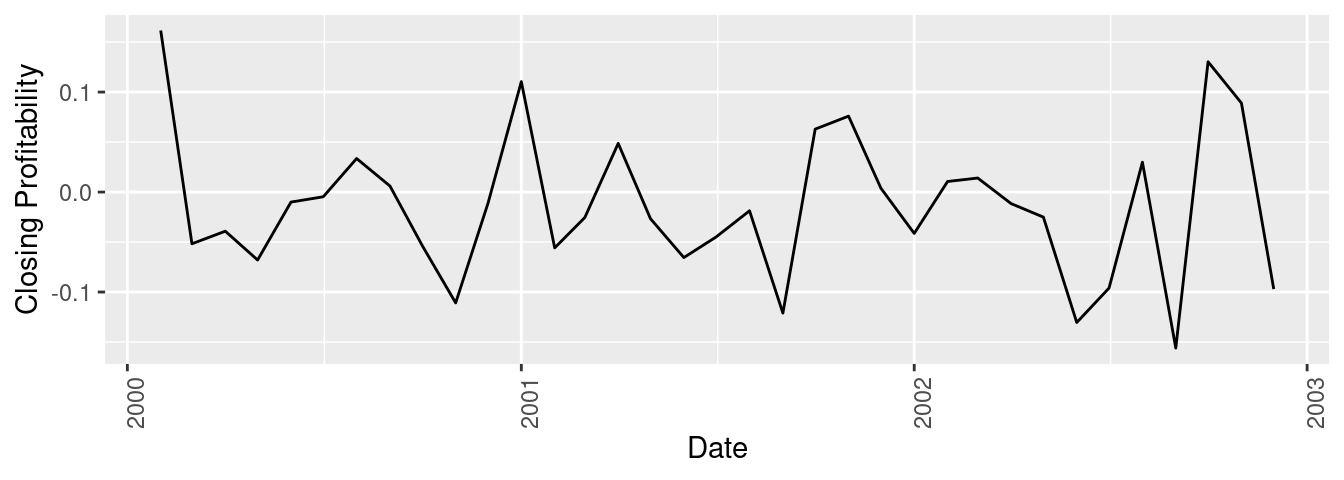
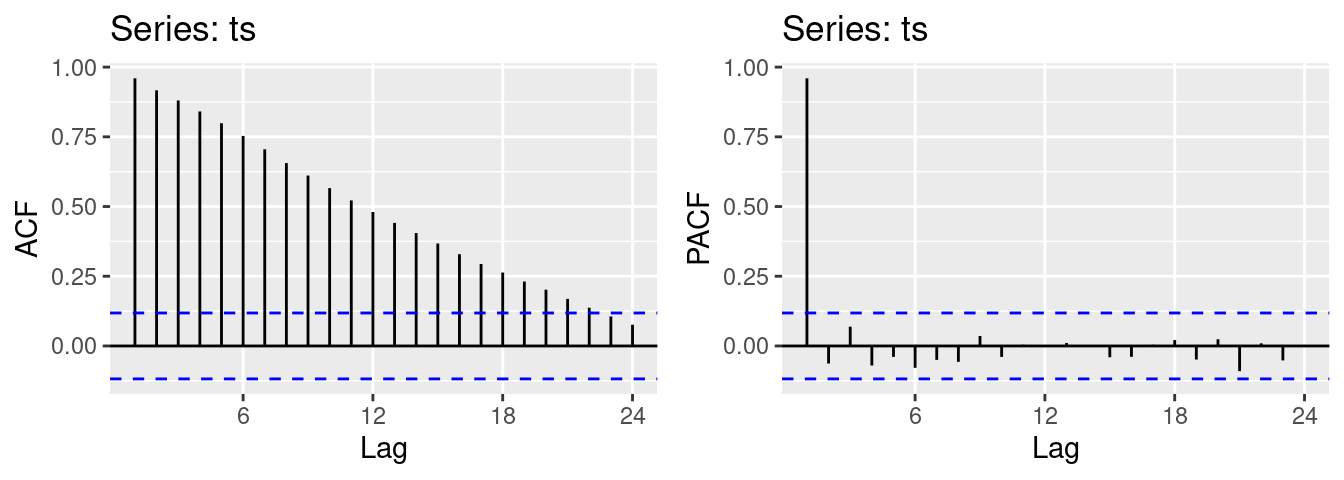
Own elaboration: By using RStudio with the IBEX historical database obtained from https://finance.yahoo.com/, in the period from 01-2000 to 01-2003, using the returns calculated from the closing price.
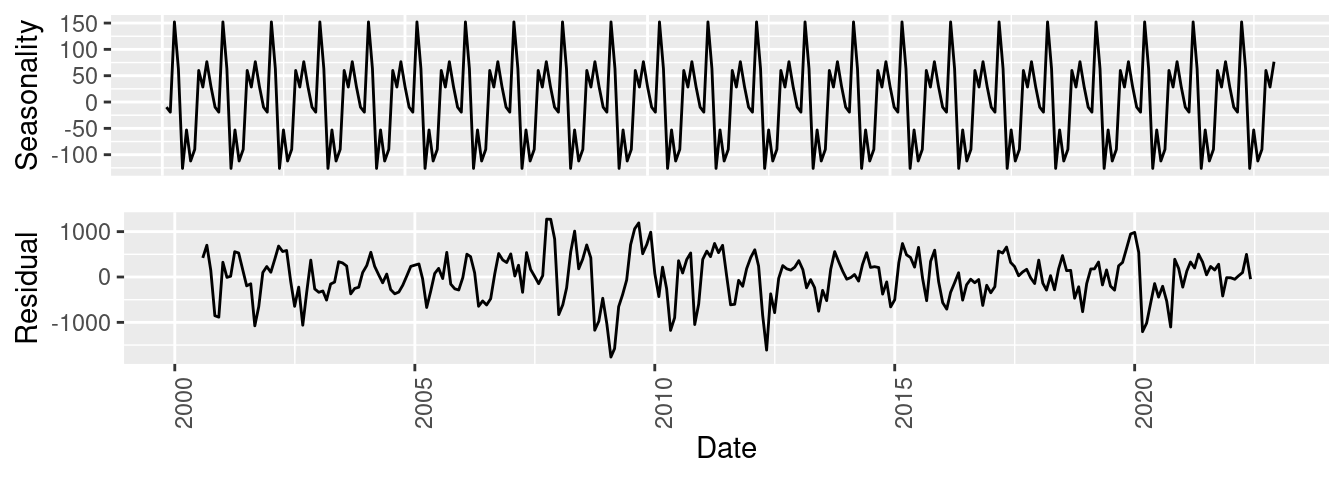
Own elaboration: By using RStudio with the IBEX historical database obtained from https://finance.yahoo.com/, decomposing the time series made up of the observations that cover the period from 01-2000 to 01-2023.
Own elaboration: By using RStudio.
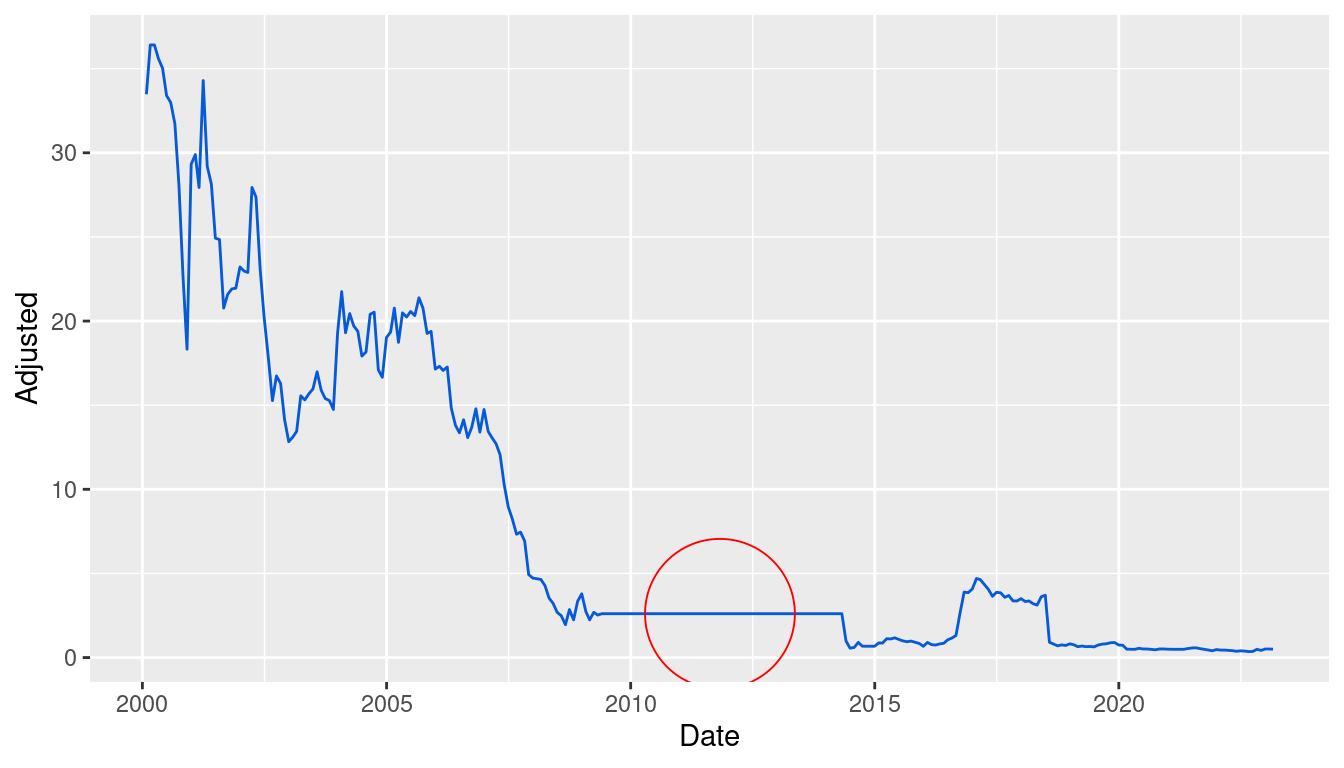
Own elaboration: Based on the data obtained from (n.d.) corresponding to the company “Nueva Expresión Textil S.A” in the period from January 31, 2000 to February 28, 2023.
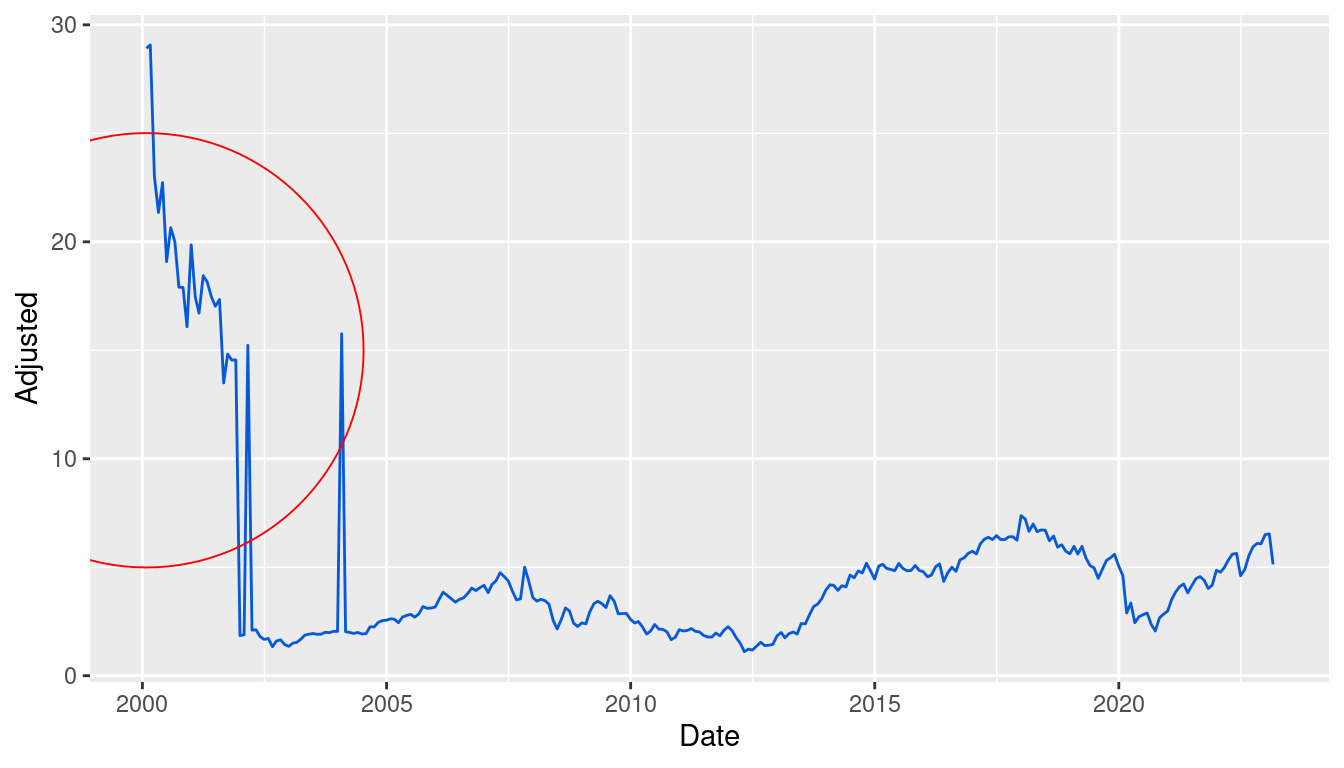
Own elaboration: Based on the data obtained from (n.d.) corresponding to the company “Nueva Expresión Textil S.A” in the period from January 31, 2000 to February 28, 2023.
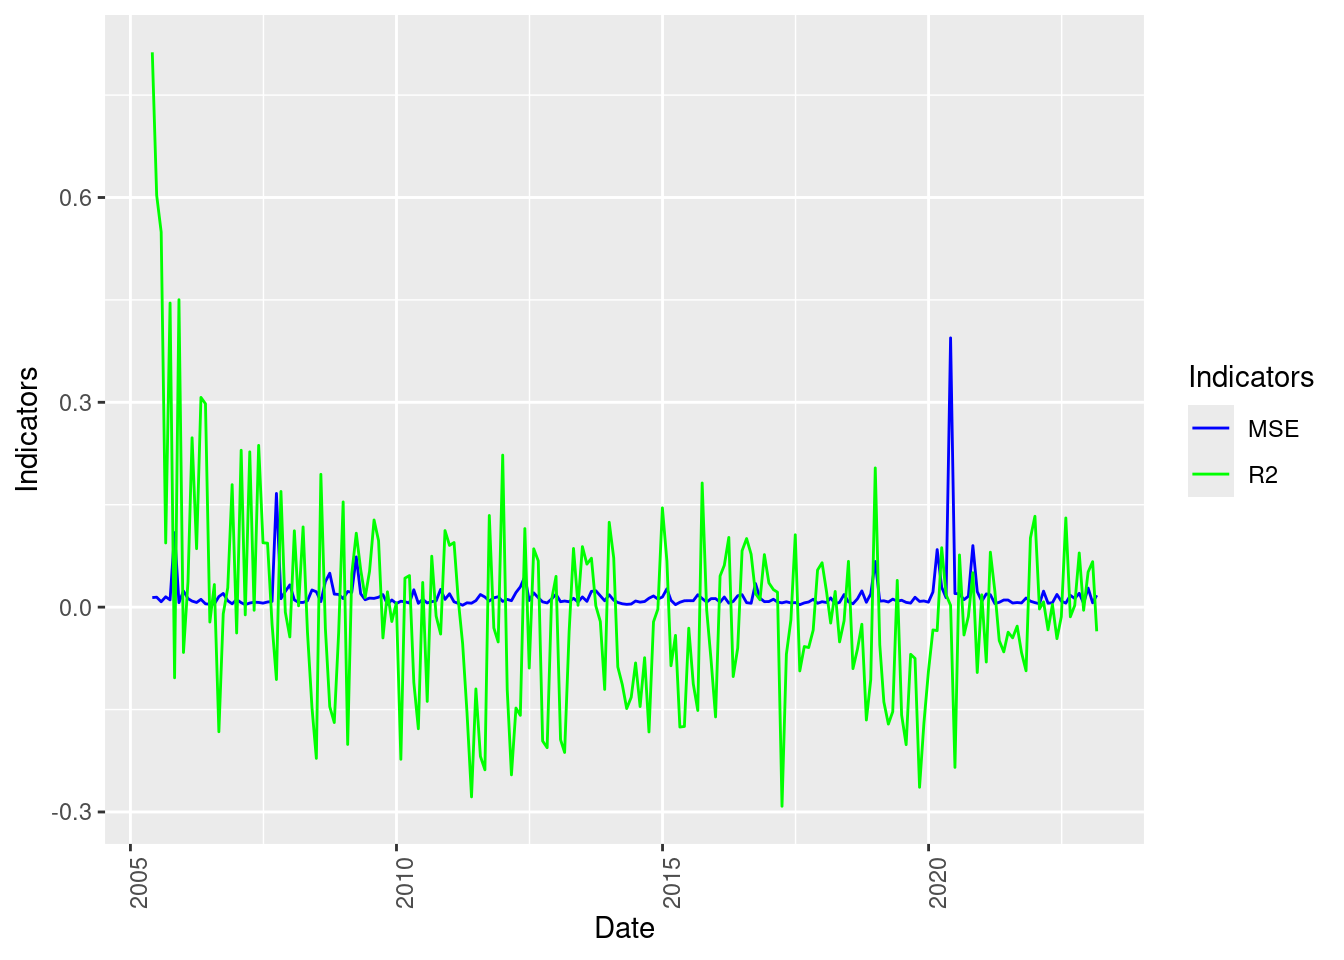
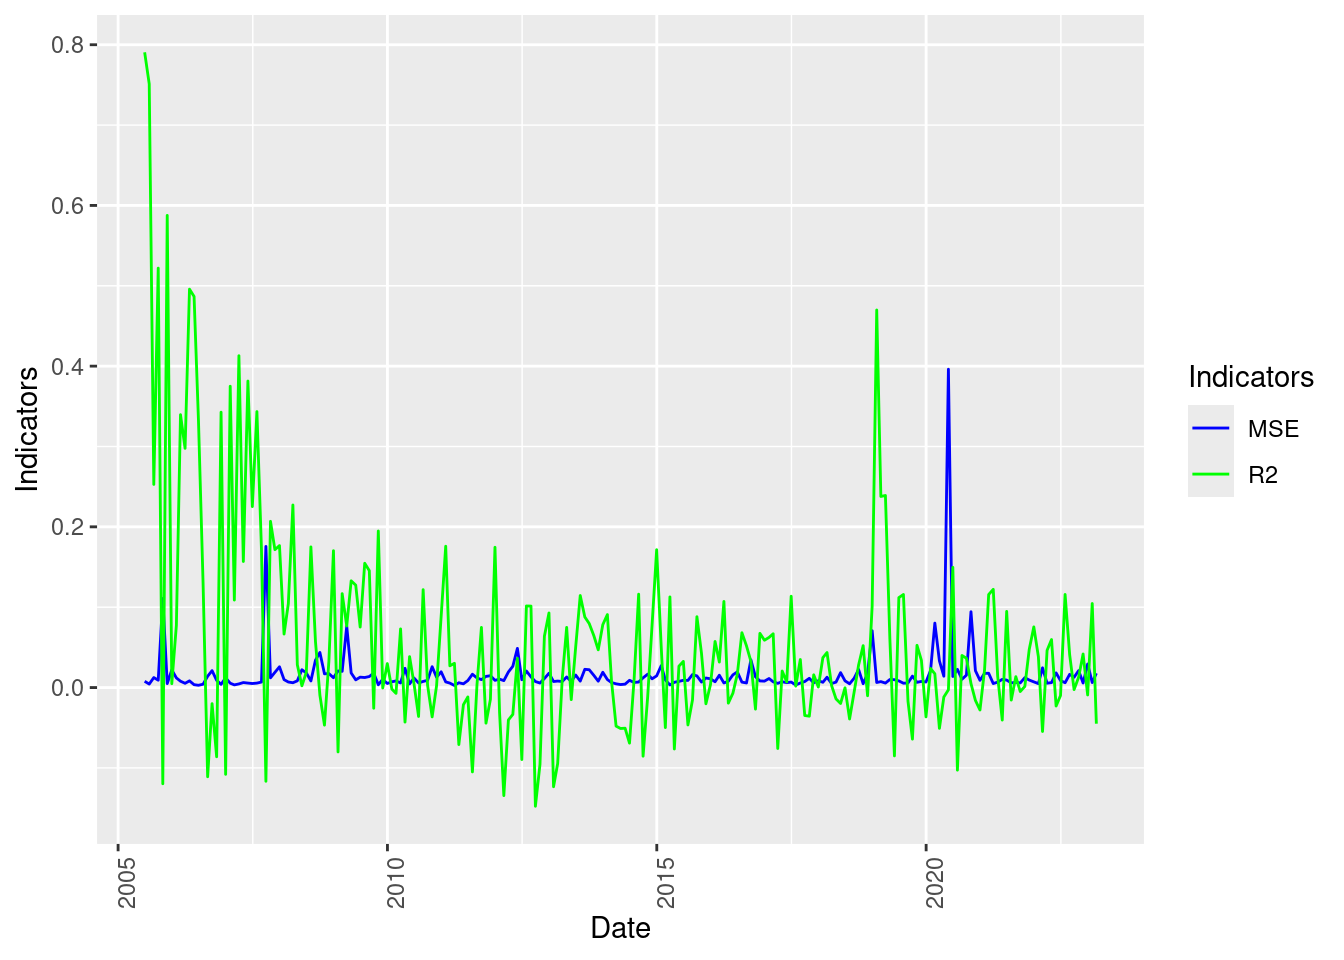
Own elaboration: Through the use of R and Rstudio.
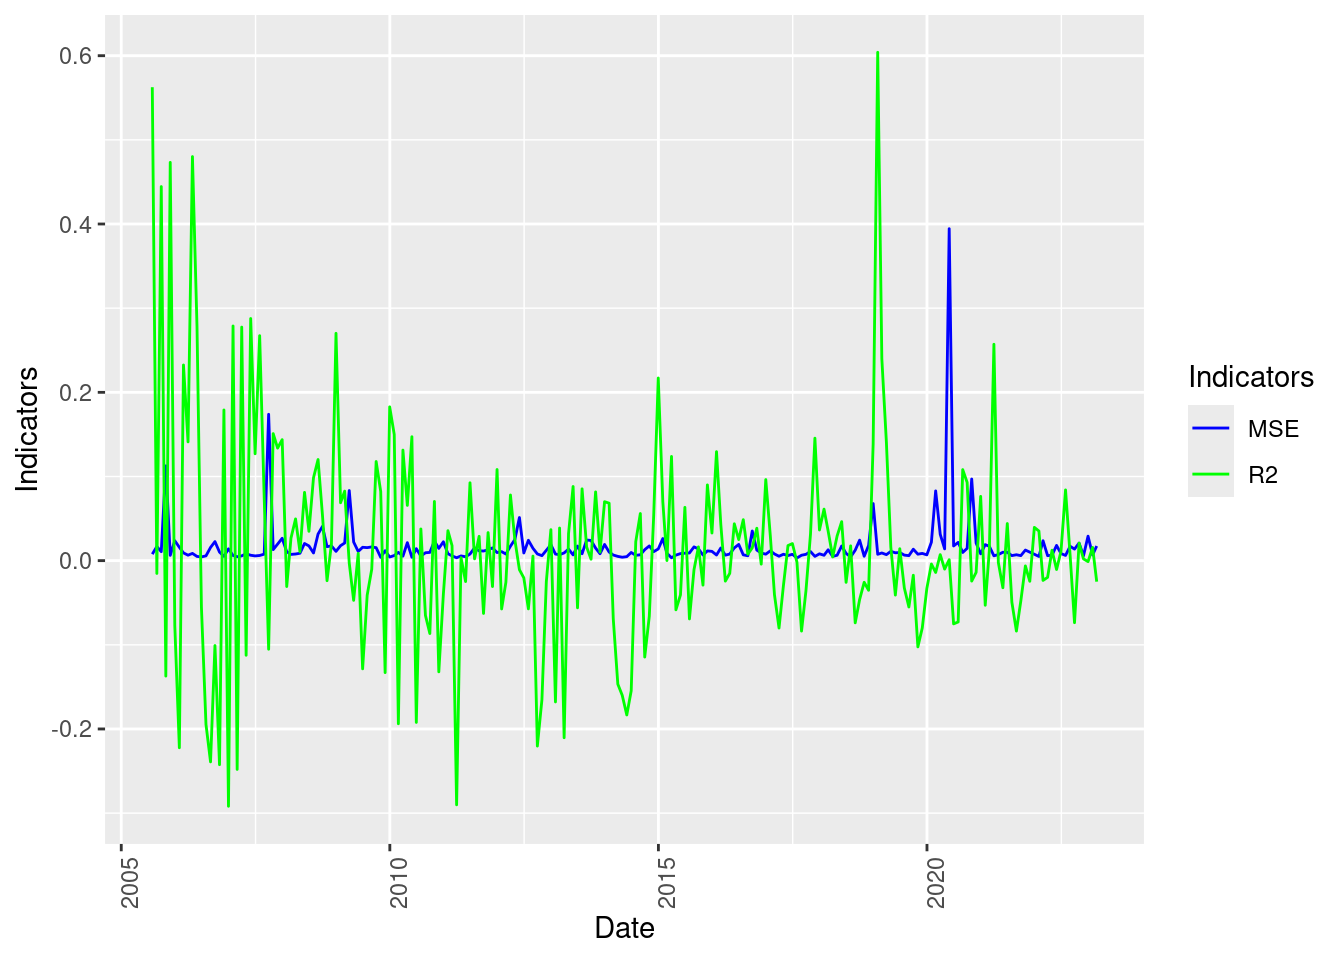
Own elaboration: Through the use of R and Rstudio.
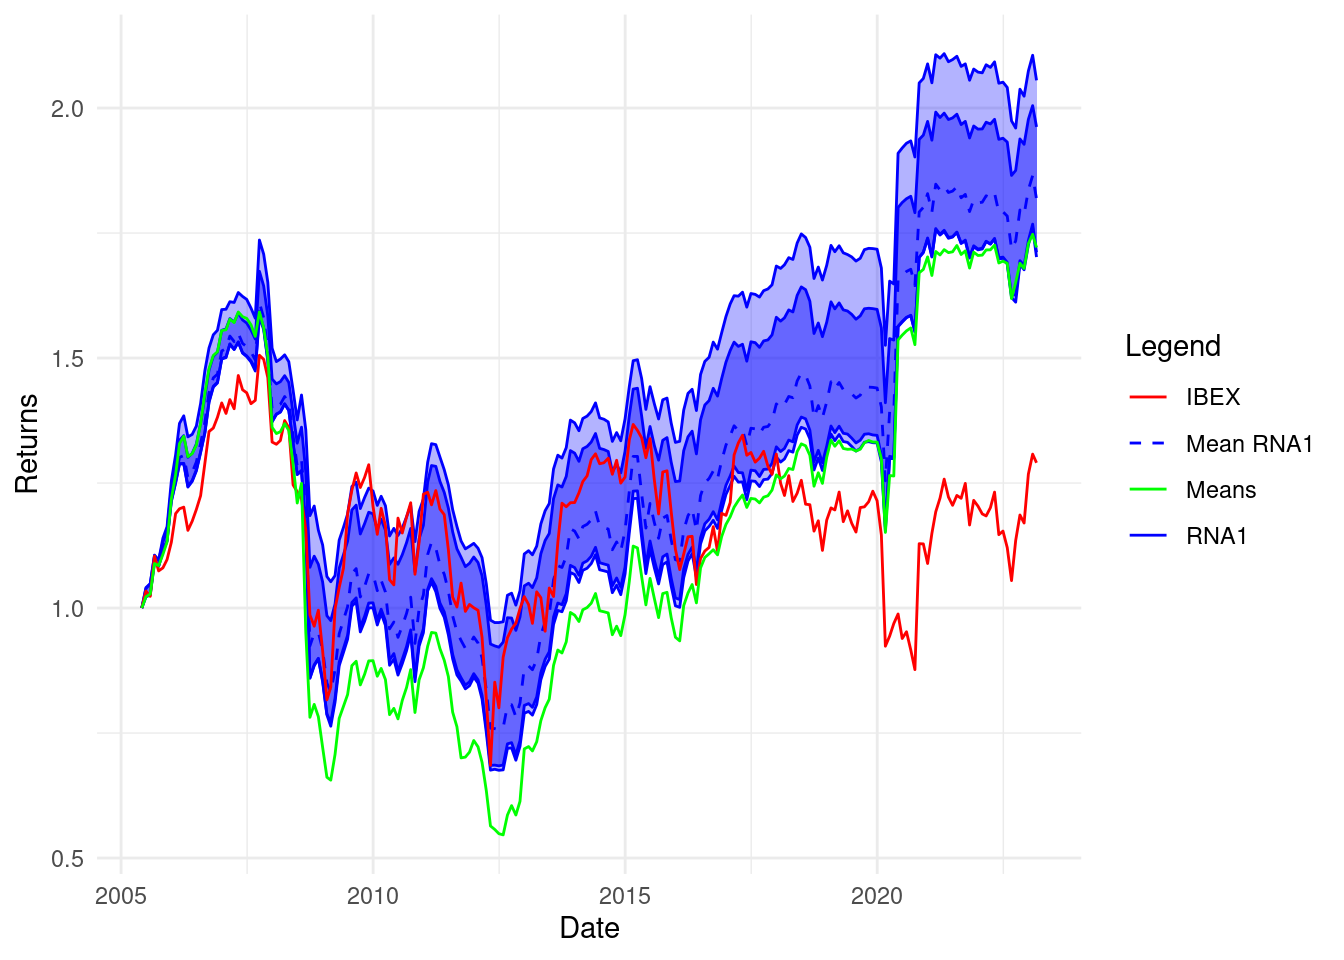
Own elaboration: Through the use of R and Rstudio.
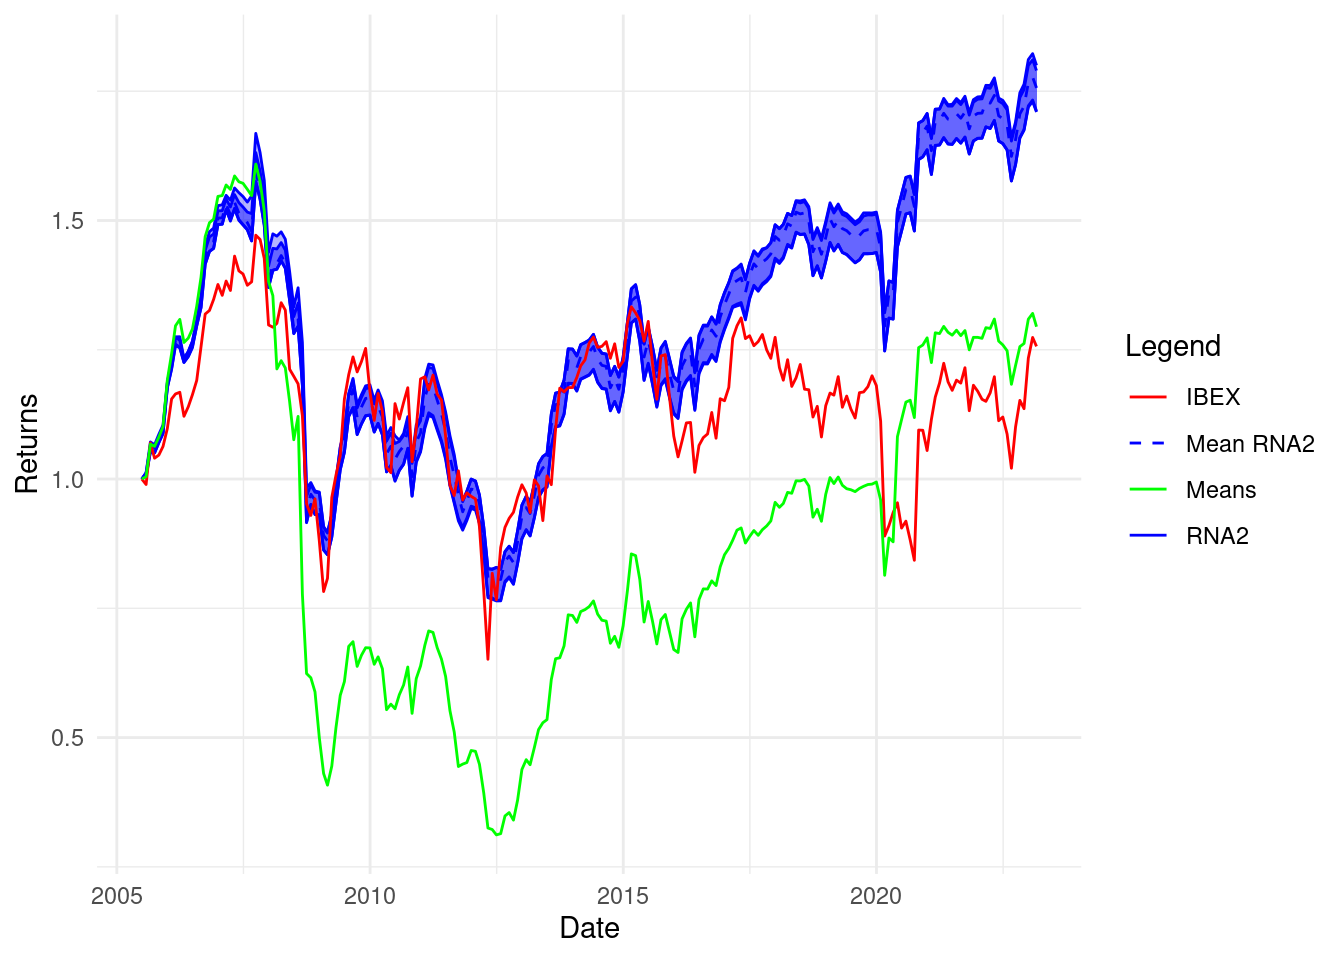
Own elaboration: Through the use of R and Rstudio.
Own elaboration: Through the use of R and Rstudio.
Own elaboration: Through the use of R and Rstudio.